
Stephen J. Morgan
EMAT 6680
Write Up #10
Prompt:

Solution:
For this assignment I started off by plotting the parametric equation on graphing calculator for various values of a and b. When I did this I made several observations. I saw that for various values of a and b, I produced graphs of circles, horizontial loops,
vertical loops, parabolas, and nets.
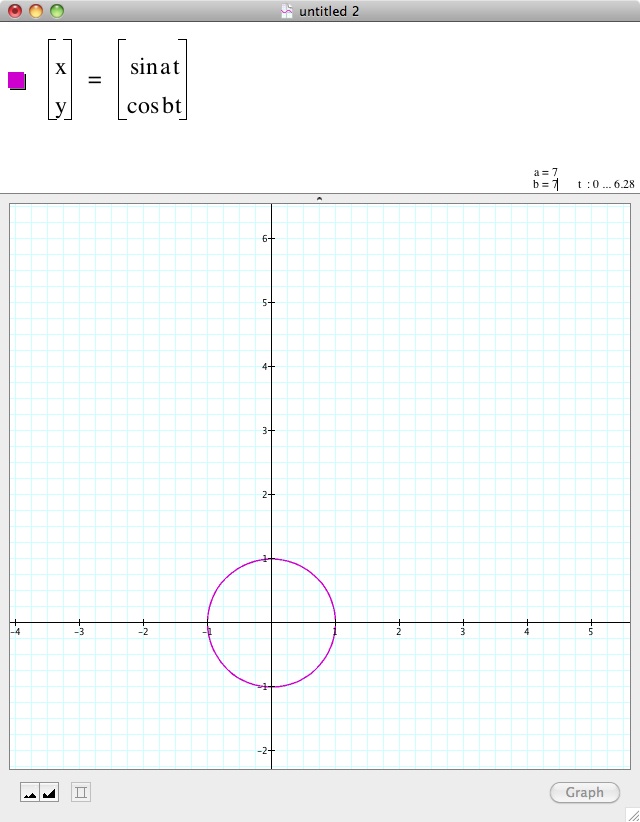
1.) The graph above is that of a circle. For this specific graph, I let a and b=7. I found that this generates a circle. I also happened to notice that for other values where a=b, I generated circles. This continued to stay true as long as we are using values greater
than or equal to 1. For a=b=0, we have no picture. For values less than 1, we have a corresponding arc that makes up part of a circle.Therefore, for values of 1 or larger when a=b a circle is generated.
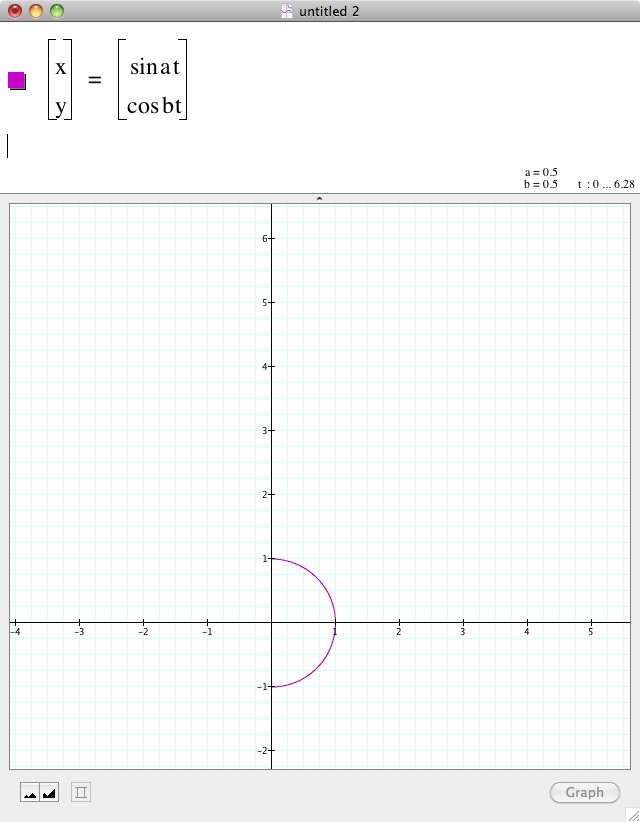
*Here is a graph where a=b=0.5. You can see, only part of a circle is present.
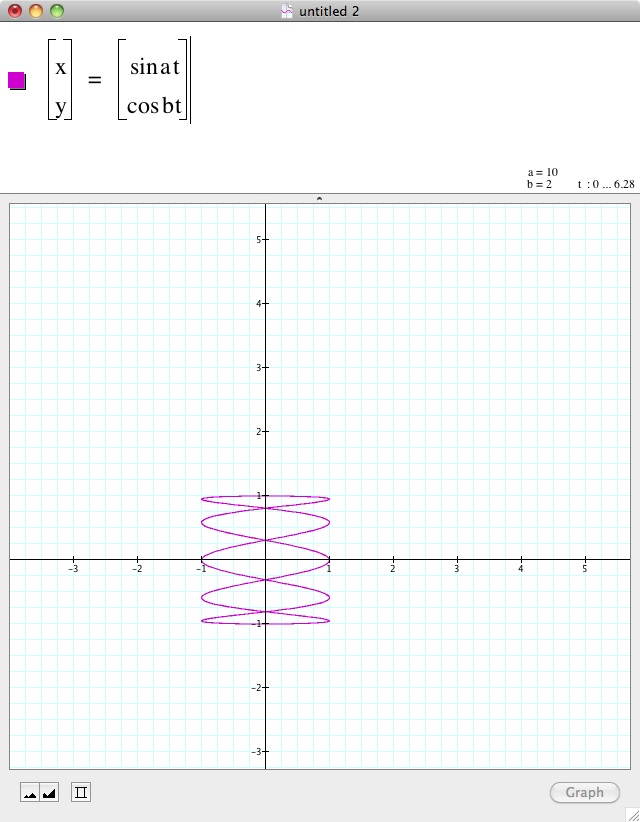
2.) The next thing I observed was that whenever a and b were both whole numbers and a divided by b yielded an integer, c, greater than 1, I generated a series of vertical loops, with c loops. In other words, if a=10 and b=2, I generated 5 horizontial loops in
the graph below. I tried other values and found this was true for where a and b where both whole numbers. Therefore, I observed that where a and b are integers and a/b= c, where c is an integer greater than 1, I generate a series of vertical loops
equal to c.
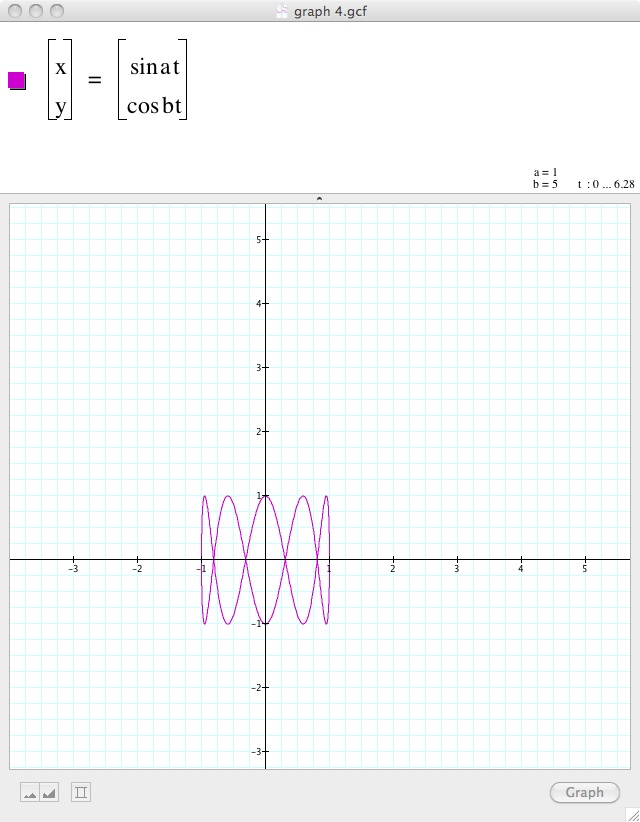
3.) The next interesting observation I made was started by letting a=1 and changing the values of b. I found out that when b=2n-1 where n is an integer, that I would generate a series of horizontial loops equal to b. However, this only worked for odd
integers. Below is a picture of the graph where a=1 and b=5. This worked for other values of b as well.
4.) Continuing on from three, I discovered that when a=1 and b=2n for any integer n, I created something that looked like a parabola with b roots. Below is a picture of a graph where a=1 and b=8. However, this worked for other values as well.

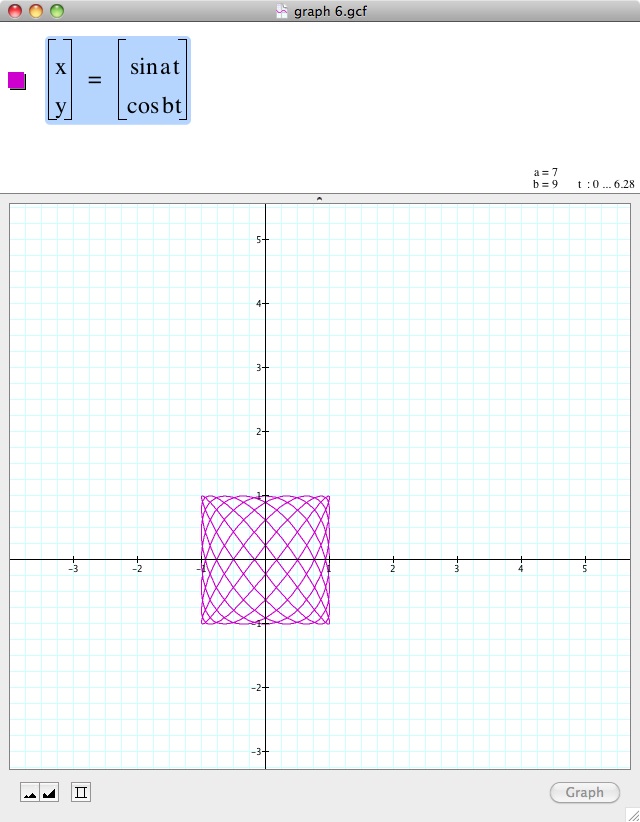
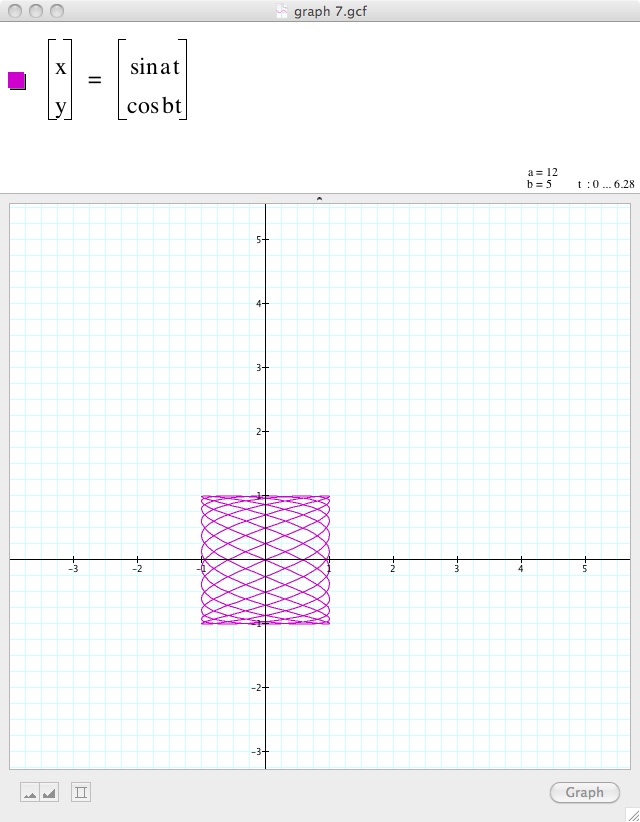
5.) Next I observed when a and b were whole numbers such that a/b was equal to a mixed number or a fraction. For fractions close to 1 (look at the first graph where a=7 and b=9) a net is generated. For fractions slightly bigger than whole numbers (look at the
second graph where (a= 12 and b=5) another net is generated. The only difference is that the first net has a horizontial orientation and the second net has a vertical orientation.
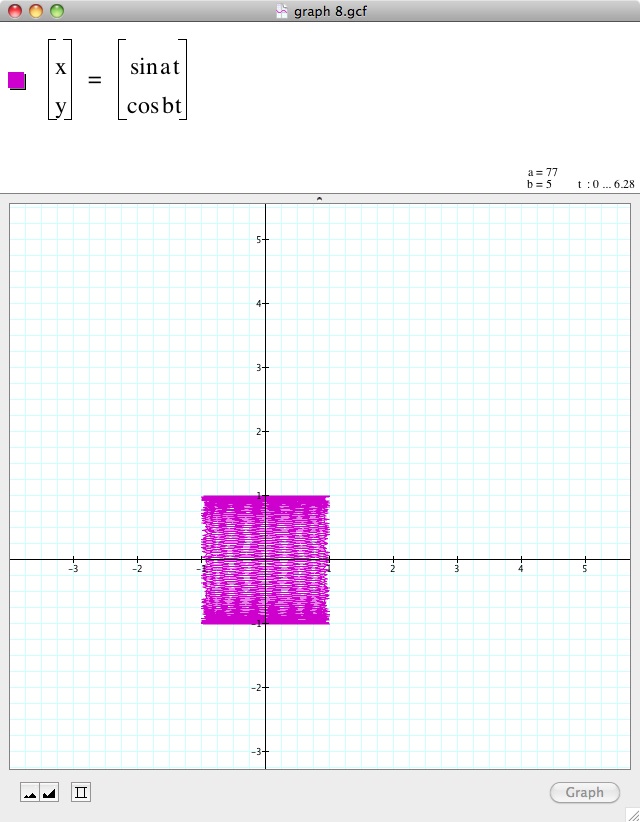
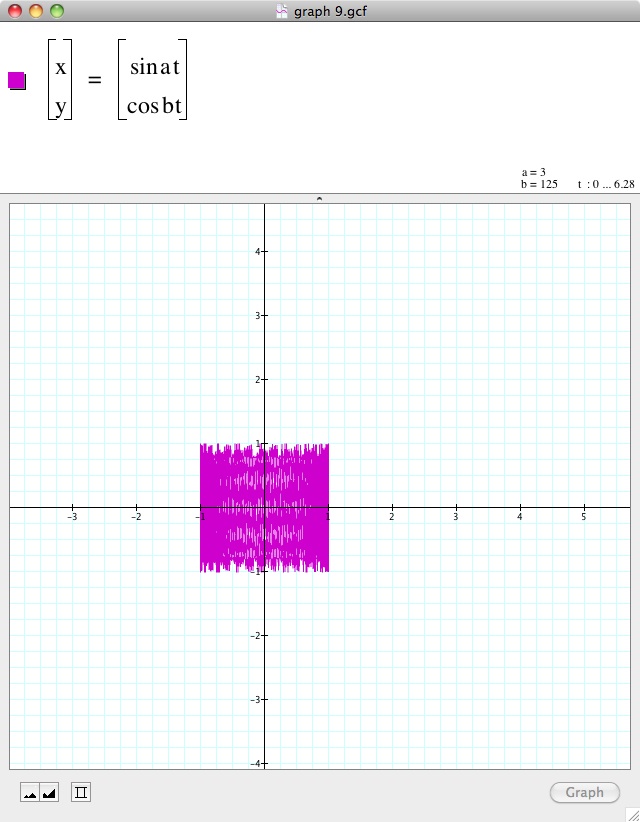
6.) I decided then to observe what happened when a is very large and b is very small and vice versa. For the first case, refer to the first graph where a=77 and b=5, we can see that we still generate a net, but the periods bunch together. It seems likely that it
would go to all values if a/b became infintely large. Likewise this is also observed when a=3 and b=125; refer to the second graph below.
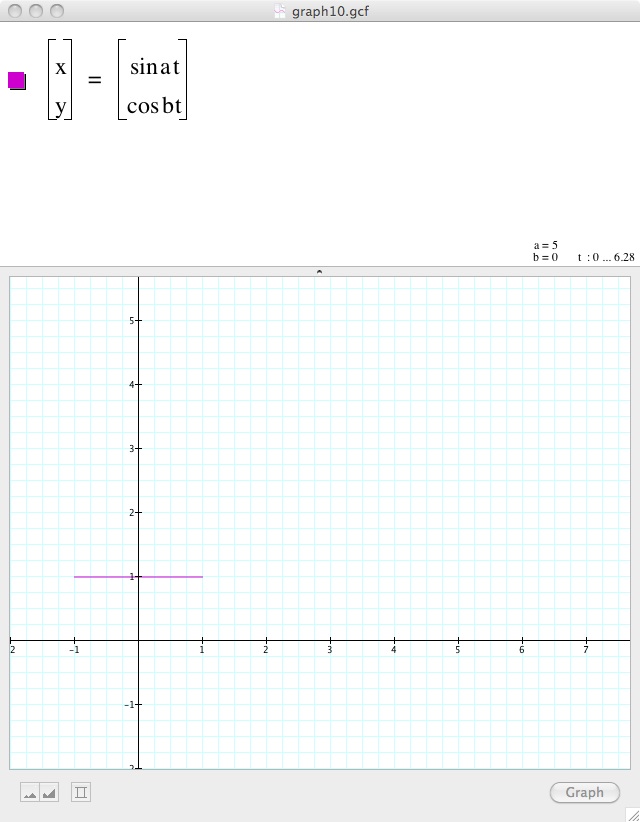
7.) The only other thing of note I observed was that when I let a=c, a constant other than 0 and b=0, a horizontial line through y=1 generated. Below is a graph showing this for when a=5 and b=0. The reason the line goes through y=1 is because the coefficent
in front of sin a (t) is 1. If it was 2, it would go through y=2, etc. It is important to note a line at a=0 and b not equal to zero does not exist since the parametric equation is undefined.
8.) I thought to investigate values where a and b were both between 0 and 1. However, this just seemed to generate skewed values of semi-circles and nothing particular of note or that I felt was worth discussing. An interesting follow up worth considering
would be where we look at these equations while also changing the coefficents in front of sin a(t) and cos b(t).